Recently I’ve seen a couple nice ‘visual’ explanations of principal component analysis (PCA). The basic idea of PCA is to choose a set of coordinates for describing your data where the coordinate axes point in the directions of maximum variance, dropping coordinates where there isn’t as much variance. So if your data is arranged in a roughly oval shape, the first principal component will lie along the oval’s long axis.
My goal with this post is to look a bit at the derivation of PCA, with an eye towards building intuition for what the mathematics is doing.
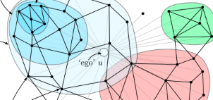
This was a bit different from other Kaggle competitions. Typically, a Kaggle competition will provide a large set of data and want to optimize some particular number (say, turning anonymized personal data into a prediction of yearly medical costs). The dataset here intrigued me because it’s about learning from and reconstructing graphs, which is a very different kind of problem. In this post, I’ll discuss my approach and insights on the problem.
Once upon a time in the late nineties, the internet was a crypto-anarchist’s dream. It was a new trans-national cyberspace, mostly free of the meddling of any kind of government, where information could be exchanged with freedom, anonymity, and (with a bit of work) security. For a certain strain of crypto-anarchist, Temporary Autonomous Zone was a guiding document, advocating small anarchist societies in the blank spaces of existing society temporarily beyond the reach of government surveillance or regulation. This was a great idea with some obvious drawbacks: On the one hand, TAZ served as a direct inspiration for Burning Man. On the other hand, it eventually came out that Peter Lamborn Wilson (who authored TAZ under the pseudonym Hakim Bey) was an advocate of pedophilia, which had clear implications as to why he wanted freedom from regulation. It’s a document whose history highlights the simultaneous boundless possibilities and severe drawbacks of anarchism.
Against this background, Lawrence Lessig’s Code made the case that the internet TAZ was in fact temporary. Lessig argued that the internet’s behaviour is determined by a combination of computer code and legal code, and that while the legal code hadn’t been written yet, it would be soon. His prediction (which has largely been realized) was that the internet would lose its anarchic character through government regulation mixed with a need for security and convenience in commercial transactions. (In addition to these forces, social media also came along, in which people largely sacrificed their anonymity willingly for the convenience of being able to easily communicate with their meatspace social networks.)
In thinking about Bitcoin, it’s useful to see how the regulation came to change the internet. The prediction (again pretty much correct) was that regulations would target large companies instead of individual users. Companies are compelled to follow the law under the ultimate threat of not being allowed to operate at all. Because of the tendency for people to glom onto just a few instances of working solutions, it becomes easy to target a few large entities to enact regulation on a broad base of users.
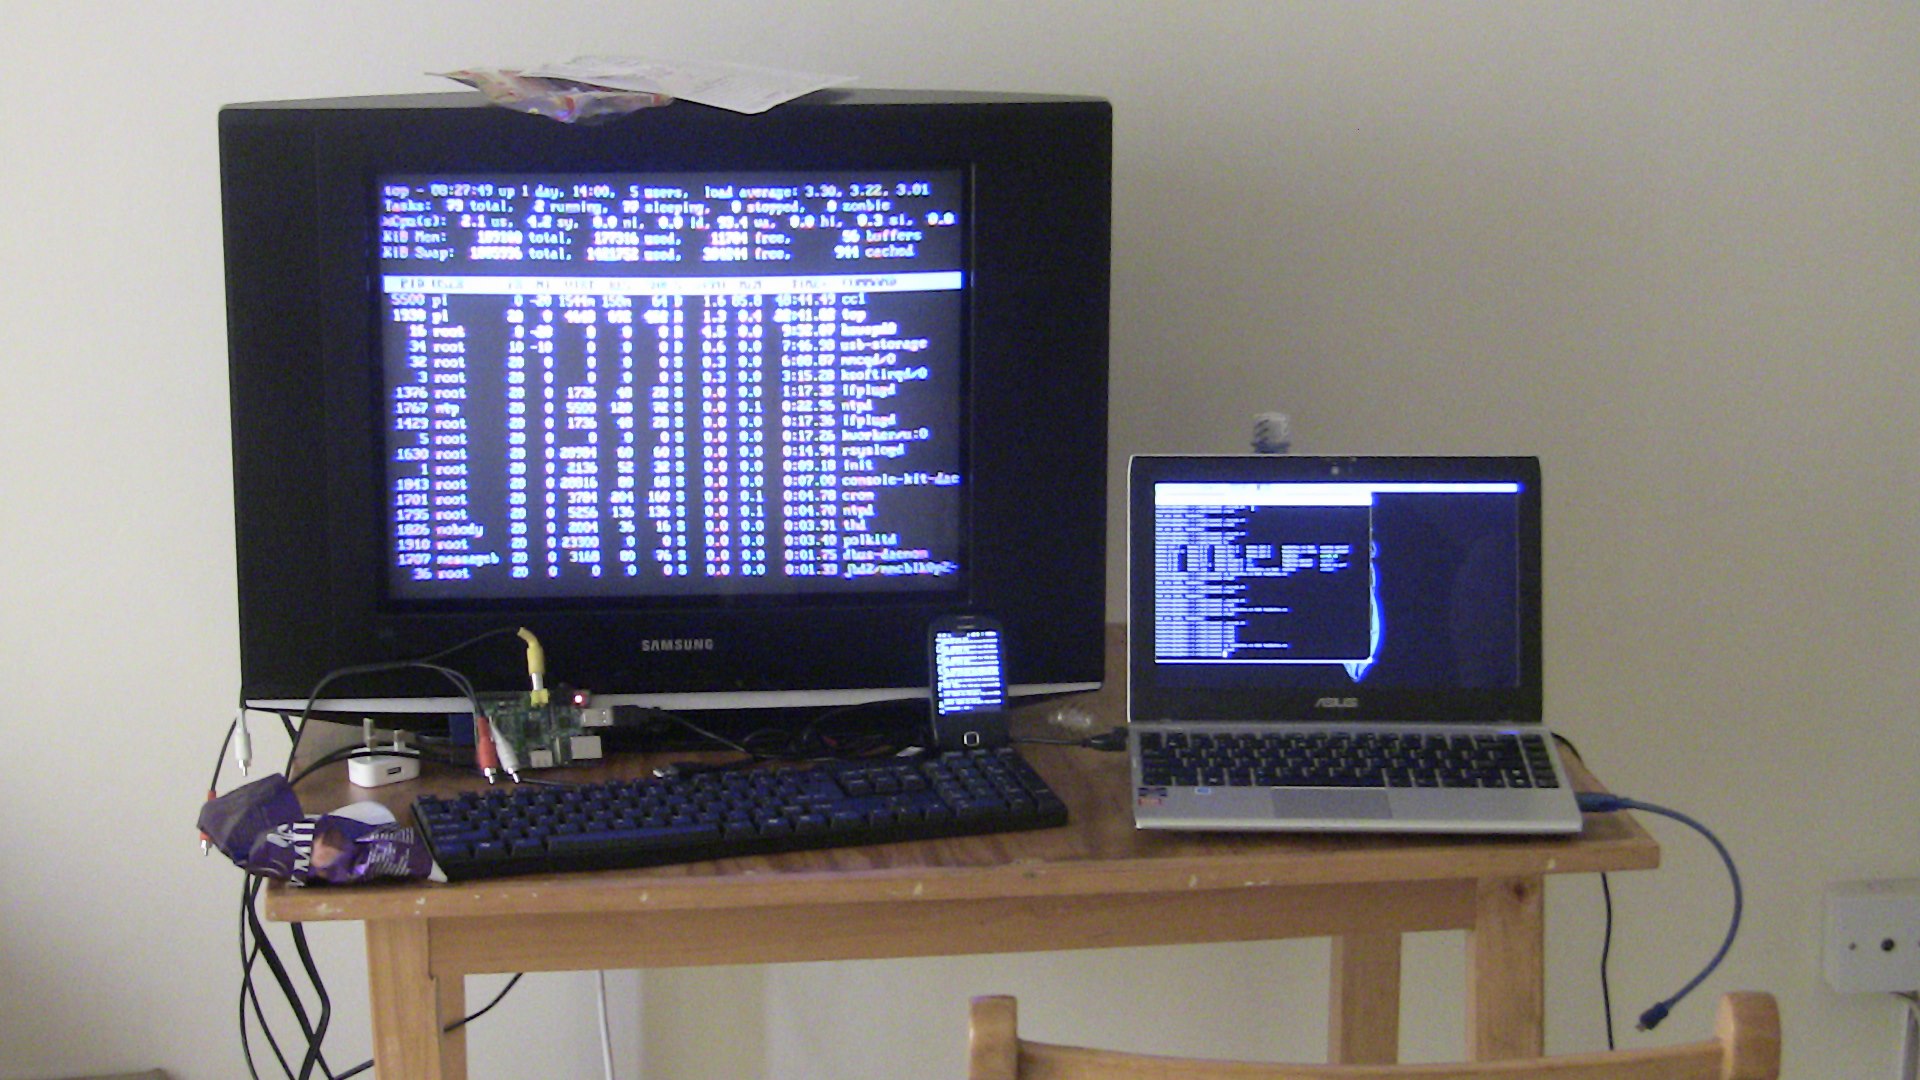
My laptop, android phone, and a Raspberry Pi plugged into a crappy hotel TV, all running terminals. This happened while trying to compile Sage on the Pi in January, 2012.
One of the graduate students asked me about how one goes about learning the Linux command line, so I thought I would write down a few of the things I think are most useful on a day-to-day basis. Such a list is sure to stir controversy, so feel free to comment if you see a grievous omission. In fact, I learned the command line mainly through installing Gentoo Linux back before there was any automation whatsoever in the process, and suffering through lengthy forum posts getting every bit of my system more-or-less working. (Note: Starting with Gentoo is probably a bad idea. I chose it at the time because it had the best forums, but there are probably better places to start these days. I mainly use Xubuntu these days.)
So, off to the races. I’m going to skip the really, really basic ones, like ls, cd, apt-get and sudo. In fact, there’s a nice tutorial at LinuxCommand.org which covers a lot of the basics, including IO redirection. Finally, I’m assuming that one is using the bash terminal.
Two years after a friend gave me a copy, I finally got around to reading Flann O’Brien’s ‘The Third Policeman.’ I liked the part with the bicycles. (Which is to say, pretty much the whole book.) Lots of spoilers below, if you’re afraid of that sort of thing, for a book written around 1940 and published in 1966.
Google unveiled it’s newest iteration of the driverless car, this time without a steering wheel or brake pedals. It looks a bit like a smart car crossed with a Beetle and a koala, but I’m still pretty excited about it.
I have never bothered to get a driver’s license, and it seems now like I was a (relatively) early-adopter of car-free life instead of a life-long freak: the proportion of young people with licenses has been steadily declining over the last ten years. When I was 16, I looked around and saw lots of teenagers getting crappy cars to drive to crappy jobs to pay for their crappy cars, and decided that I didn’t really want to be involved in that cycle. Spending 15-30 hours working at Dairy Queen didn’t seem like a terribly valuable experience.
Back in late December, I planted a Raspberry Pi camera at a cottage on Georgian Bay, in Northern Ontario, set to take a picture once every two minutes. I had been planning the shoot for a couple months prior to the deployment: There were two Raspberry Pi’s involved, in case one failed somewhere during the winter. One of the Pi’s was set to reboot once a week, just in case the software crashed but the Pi was still awake. I had also written some software for the time-lapse to ensure that pictures were only taken during the day time, and to try to maintain a balance of well-lit, consistent images over the course of each day.
In spite of all the planning, I had a sense that something would go horribly wrong, and, indeed, when we showed up to the cottage, the windows were completely frosted over. The cameras had to be placed inside, so we figured we would mainly see the back-side of an icy window when we retrieved the cameras. Or that the camera boards would literally freeze after about a week of sub-zero temperatures in the unheated cottage. Or that a raccoon would find it way in and gnaw through the shiny Lego cases. Or something else entirely unplanned for.
So it was a bit of a surprise when it turned out that the shoot went perfectly. We retrieved the cameras about a week ago, on May 7th, and found over 42,000 photos waiting for us on one of the cameras and somewhat fewer on the other. Both cameras had survived the winter just fine!
All told, I think the result was really cool! The video at the top is the ‘highlights’ reel, with all of the best days. It comes to 13 minutes at 18 frames per second. Turns out it was a fantastic winter for doing a time-lapse, with lots of snow storms and ice. There’s even the occasional bit of wildlife, if you watch closely. I’ll post the full 40-minute time-lapse on Youtube sometime next week.
The talk was about using Fourier transforms to get polynomial-time encodings of permutation statistics, as well as a look at the Kondor-Borgwardt approach to graph invariants via the Fourier transform over . The talk was given at a representation theory conference, and I was making the point that we can get new research ideas by taking trips into the world of applications – in my case, by looking at machine learning problems. The opening joke was that I asked my computer for the best possible title for the talk, and received the click-bait title as a response. It was admittedly a pretty funny moment watching the chair of the session trying to decide whether to read the title originally submitted for the talk (‘Compressed Combinatorial Statistics’) or the ridiculousness on the screen (he went with the original).
I attended a really nice talk by Arash Amini yesterday about detecting ‘communities’ in sparse graphs. The basic problem is: In a big graph (like the Facebook graph, or the graph of scientific papers citations) you have clusters of friends/associates, and you want to pick out those clusters. Dr. Amini and his collaborators have been working on methods to solve this problem in particularly noisy cases. The methods presented were developed for cases where you know the specific number of clusters you are seeking to find. It was a fascinating talk, and I came away wondering if there are good methods to use when you aren’t sure of how many clusters there are.
At the left is a randomly generated block-diagonal adjacency matrix (using a stochiastic block model). The center is the same matrix with the rows randomly shuffled; you can’t “see” that it has block diagonal structure. The right is the matrix with blocks recovered using the techniques outlined in this post. Note the noise in the lower-right corner; these correspond to individual, isolated vertices that ended up in their own clusters.
I’ve finally had a bit of time to finish up the code for the Rock-Paper-Scissors bot discussed in the previous posts; I’ve put the code in a GitHub repository here. Feel free to file issues if you would like it to be a bit more user friendly.
Win percentage over time, Diaconis vs Switchbot. As time increases, the win percentage settles in on 2/3’s which is a natural limit for play against Switchbot.
The bot which uses the Fourier transform on move probabilities to search for profitable patterns is named `diaconis`, after Persi Diaconis. It’s currently working just fine, but is a bit slow computationally. On startup, it generates all possible move patterns that it will investigate during the course of each game, as well as some character tables. After each play, it tests some of these patterns, and tries to determine if their predictive power is better than any of the patterns seen thus far. If so, it begins using that pattern to choose move probabilities.
This works fine as a proof-of-concept of the basic ideas. Additional improvements could be had by doing some code optimization to speed things up a bit, and keeping a list of good patterns and allowing a bit more dexterity in switching between the patterns used for prediction.


 . The talk was given at a representation theory conference, and I was making the point that we can get new research ideas by taking trips into the world of applications – in my case, by looking at machine learning problems. The opening joke was that I asked my computer for the best possible title for the talk, and received the click-bait title as a response. It was admittedly a pretty funny moment watching the chair of the session trying to decide whether to read the title originally submitted for the talk (‘Compressed Combinatorial Statistics’) or the ridiculousness on the screen (he went with the original).

