Animating Stable Diffusion Embeddings

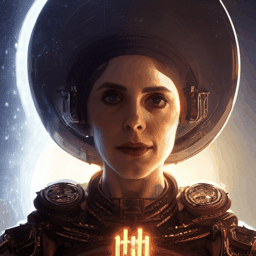
Stable Diffusion is the best neural text-to-image engine you can run on your own hardware. I recently picked up a new 3090 for my home machine, and spent a couple weekends messing around with Stable Diffusion. Initially, I’ve been using it to generate concept art for a game of Apocalypse World, a tabletop roleplaying game. Stable Diffusion really shines in this space; the creation of the concept art becomes a bit of a collaborative dance, as I find new ideas in the ML output that might get incorporated into the game. The rich imagery also helps create a shared universe for the players, not too unlike the incredibly rich art that TTRPG books tend to invest in. And the small scale of a single TTRPG game, with just a few players, means that we can add concept art to a place where it never would have existed before. These kinds of ML tools are fantastic for lowest-rent collaborative creative exercises.

An abandoned gas station, generated with Stable Diffusion.

Having full access to the model + execution code makes it really straightforward to get into the guts and start tinkering with non-standard use cases. I was particularly interested in mucking around with the various latent/hidden representations used by the model. In this post, I’ll a) explain the parts of the model (briefly), then explain how I b) used the text embedding latents to create some simple animations and c) to sample lots of minor variations of an image.

An animation transitioning between five different text prompt embeddings (and back again).

Model overview

To get started, it’s quite easy to copy the ‘Writing your own inference pipeline‘ section of the Stable Diffusion docs on HuggingFace. Copy out the process, and then check that the code actually runs and produces images.

To start mucking around with the latents, it helps to have a good understanding of the model structure.

  1. The model takes as inputs a text prompt and a random seed.
  2. These are used to create a text embedding and initial pure-noise VAE latents.
  3. The diffusion algorithm progressively de-noises the VAE latents to obtain a ‘clean’ latent image which matches the text prompt to some extent. (As an aside, at each step new noise is generated and added to the de-noised image; you really need to use the same random generator seed, and not just the same initial noisy VAE latent.)
  4. The VAE decoder (very quickly) converts the de-noised latent image to a full sized output image.
Diagram of Stable Diffusion inputs, embeddings, and sub-models.
The various parts of Stable Diffusion.

So, if you run the same text prompt from the same random seed, you get the same image. Now, it turns out that a small change in the text embedding space mostly corresponds to a small change in the output image. This continuity makes the text embedding space a good playground.

Note that the VAE image latents are actually a pretty boring space, by comparison: the latents have shape [4, 64, 64] where the last dimensions correspond to image height and width. This blog post shows that the VAE latents are actually quite close to the image already. You can get some kind of effects by manipulating the VAE latents (for example, sending x to -x takes the color negative of the image more or less), but these effects aren’t terribly interesting, like degraded versions of what you’d try to do in Photoshop.

Morph Animations

Often you can make relatively small changes in the prompt and (so long as you use the same seed) you’ll bet back a very similar image, with some changes in the details. Then you can make a morph animation by ‘walking’ from one text embedding to the other, generating new images along the way. In the image morph animation, I’ve changed the famous actress’ name only, leaving the rest of the prompt the same, and connected the two with 16 transition frames.

KD, Technopriest, morphing into AB, Technopriest.

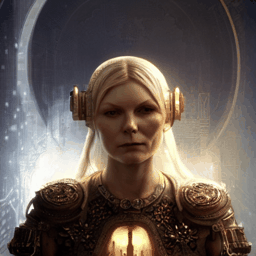
Stable Diffusion isn’t great at making random faces (you tend to get mosnters), but tends to get the details /mostly/ right for famous people who show up in the dataset a lot. So, to get a good face, pick a famous name. The text embedding transformation gives a nice way to deal with the casual-deepfake problem, though: most of the ‘intermediate’ faces are still good, so we can create text embeddings for a couple-few people, interpolate, and then choose one which doesn’t look too much like any of the ‘source’ faces.

Here’s another example, interpolating between an abandoned street in a city vs a forest. The basic composition remains the same in both images, but one is full of buildings and neon, and the other is full of trees.

A rainy city which is also a rainy forest.

Generating Variations

Another neat application of continuity in the text embedding space is that you can use it to explore closely-related images and try to find something sliiightly better than the initial output. You can add noise repeatedly to the base text embedding to get lots of variants, in other words.

AB Technopriest variations.

For this image, I added Gaussian noise to the text prompt with standard deviation 0.02 repeatedly. This was structured as a random walk: each new embedding y[k] = 0.5 * y[0] + 0.5 * (y[k-1] + noise). This can potentially create a nice animation over a longer random walk, as we have some coherency between adjacent steps. The first term (0.5*y[0]) ensures that we stay in the neighborhood of the original image.

Seeing Like a Statistical Learning Algorithm

image

I recently had the pleasure of reading James Scott’s “Seeing Like a State,” which examines a certain strain of failure in large centrally-organized projects. These failures come down to the kinds of knowledge available to administrators and governments: aggregates and statistics, as opposed to the kinds of direct experience available to the people living ‘on the ground,’ in situations where the centralized knowledge either fails to or has no chance to describe a complex reality.  The book classifies these two different kinds of knowledge as techne (general knowledge) and metis (local knowledge).  In my reading, the techne – in both strengths and shortcomings – bears similarity to the knowledge we obtain from traditional algorithms, while metis knowledge is just starting to become available via statistical learning algorithms.

In this (kinda long) post, I will outline some of the major points of Scott’s arguments, and look at how they relate to modern machine learning.  In particular, the divides Scott observes between the knowledge of administrators and the knowledge of communities suggest an array of topics for research.  Beyond simply looking at the difference between the ways that humans and machines process data, we observe areas where traditional, centralized data analysis has systematically failed. And from these failures, we glean suggestions of where we need to improve machine learning systems to be able to solve the underlying problems.

Continue reading

4D Scatter Plotting

I recently read Edward Tufte’s ‘Visualizing Quantitative Information,’ a classic book on visualizing statistical data.  It reads a little bit like the ‘Elements of Style’ for data visualization: Instead of ‘omit needless words,’ we have ‘maximize data-ink.’  Indeed, the primary goal of the book is to establish some basic design principles, and then show that those principles, creatively applied, can lead to genuinely new modes of representing data.

One of my favorite graphics in the book was a scatter plot adapted from a physics paper, mapping four dimensions in a single graphic.  It’s pretty typical to deal with data with much more than three dimensions; I was struck by the relative simplicity with which this scatter plot was able to illustrate four dimensional data.

I hacked out a bit of python code to generate similar images; here’s a 4D scatter plot of the Iris dataset:

scatter4d
4D scatter plot of the Iris dataset

Continue reading

Machine Learning Resources for Mathematicians

What it feels like to wade into a new field.

I met up with some mathematician friends in Toronto yesterday, who were interested in how one goes about getting started on machine learning and data science and such.  There’s piles of great resources out there, of course, but it’s probably worthwhile to write a bit about how I got started, and place some resources that might be of more interest to people coming from a similar background.  So here goes.
First off, it’s important to understand that machine learning is a gigantic field, with contributions coming from computer science, statistics, and occasionally even mathematics…  But on the bright side, most of the algorithms really aren’t that complicated, and indeed they can’t be if they’re going to run at scale.  Overall though, you’ll need to learn some coding, algorithms, and theory.

Oh, and you need to do side-projects.  Get your hands dirty with a problem quickly, because it’s the fastest way to actually learn.

Continue reading

Principal Component Analysis via Similarity

PCA illustration from Wikipedia.

Recently I’ve seen a couple nice ‘visual’ explanations of principal component analysis (PCA).  The basic idea of PCA is to choose a set of coordinates for describing your data where the coordinate axes point in the directions of maximum variance, dropping coordinates where there isn’t as much variance.  So if your data is arranged in a roughly oval shape, the first principal component will lie along the oval’s long axis.

My goal with this post is to look a bit at the derivation of PCA, with an eye towards building intuition for what the mathematics is doing.

Continue reading

Kaggle Social Networks Competition

front_pageThis week I was surprised to learn that I won the Kaggle Social Networks competition!

This was a bit different from other Kaggle competitions.  Typically, a Kaggle competition will provide a large set of data and want to optimize some particular number (say, turning anonymized personal data into a prediction of yearly medical costs).  The dataset here intrigued me because it’s about learning from and reconstructing graphs, which is a very different kind of problem.  In this post, I’ll discuss my approach and insights on the problem.

Continue reading

Finding Community

I attended a really nice talk by Arash Amini yesterday about detecting ‘communities’ in sparse graphs.  The basic problem is: In a big graph (like the Facebook graph, or the graph of scientific papers citations) you have clusters of friends/associates, and you want to pick out those clusters. Dr. Amini and his collaborators have been working on methods to solve this problem in particularly noisy cases.  The methods presented were developed for cases where you know the specific number of clusters you are seeking to find.  It was a fascinating talk, and I came away wondering if there are good methods to use when you aren’t sure of how many clusters there are.

communities
At the left is a randomly generated block-diagonal adjacency matrix (using a stochiastic block model). The center is the same matrix with the rows randomly shuffled; you can’t “see” that it has block diagonal structure. The right is the matrix with blocks recovered using the techniques outlined in this post. Note the noise in the lower-right corner; these correspond to individual, isolated vertices that ended up in their own clusters.

Continue reading

RoShamBo Part IV: Implementation

I’ve finally had a bit of time to finish up the code for the Rock-Paper-Scissors bot discussed in the previous posts; I’ve put the code in a GitHub repository here.  Feel free to file issues if you would like it to be a bit more user friendly.

Win percentage over time, Diaconis vs Switchbot.  As time increases, the win percentage settles in on 2/3's which is a natural limit for play against Switchbot.
Win percentage over time, Diaconis vs Switchbot. As time increases, the win percentage settles in on 2/3’s which is a natural limit for play against Switchbot.

The bot which uses the Fourier transform on move probabilities to search for profitable patterns is named `diaconis`, after Persi Diaconis. It’s currently working just fine, but is a bit slow computationally. On startup, it generates all possible move patterns that it will investigate during the course of each game, as well as some character tables. After each play, it tests some of these patterns, and tries to determine if their predictive power is better than any of the patterns seen thus far. If so, it begins using that pattern to choose move probabilities.

This works fine as a proof-of-concept of the basic ideas. Additional improvements could be had by doing some code optimization to speed things up a bit, and keeping a list of good patterns and allowing a bit more dexterity in switching between the patterns used for prediction.

Roshambo Part III – Representation Theory

In the last two posts, we’ve looked at using machine learning for playing iterated Roshambo.  Specifically, we saw how to use Bayes’ theorem to try to detect and exploit patterns, and then saw how Fourier transforms can give us a concrete measurement of the randomness (and non-randomness) in our opponent’s play.  Today’s post is about how we can use representation theory to improve our chances of finding interesting patterns.

Niels Henrik Abel, for whom 'Abelian groups' are named.
Niels Henrik Abel, for whom ‘Abelian groups’ are named.  These are groups where xy=yx for any x, y.

Continue reading

Roshambo Part II – Fourier Analysis

In the last post, we looked at using an algorithm suggested by Bayes’ Theorem to learn patterns in an opponent’s play and exploit them.  The game we’re playing is iterated rock-paper-scissors, with 1000 rounds of play per game.  The opponent’s moves are a string of choices, ‘r’, ‘p’, or ‘s’, and if we can predict what they will play, we’ll be able to beat them.  In trying to discover patterns automatically we’ll gain some general knowledge about detecting patterns in streams of characters, which has interesting applications ranging from biology (imagine ‘GATC’ instead of ‘rps’) to cryptography.

Fourier analysis is helpful in a wide variety of domains, ranging from music to image encoding.  A great example suggested by ‘Building Machine Learning Algorithms with Python‘ is classifying pieces of music by genre.  If we’re given a wave-form of a piece of music, automatically detecting its genre is difficult.  But applying the Fourier transform breaks the music up into its component frequencies, which turn out to be quite useful in determining whether a song is (say) classical or metal.

This goat recognizes and apparently enjoys metal.  Possibly using a furrier transform...
This goat recognizes and apparently enjoys metal. Possibly using a furrier transform… (sorry.)

Continue reading