Suppose we want to send a message to a friend using as few bits as possible… And let’s also suppose that this message consists of unit-normally-distributed real numbers. Now, it turns out that it’s really really expensive to send arbitrary precision real numbers: You could find yourself sending some not-previously-known-to-man transcendental number, and just have to keep listing off digits forever. So, in reality, we allow some amount of noise tolerance in the encoding.
This is a good problem to sink some effort into: Lots of data is roughly normally distributed, and if you’re sending some machine learned representation, you can introduce some regularization to ensure that the data is close to unit-normal. (This is, for example, the whole idea behind Variational Auto Encoders.)
I’ll start with a quick outline of a standard solution, and then we’ll go into a half-baked idea involving Fibonacci codes and space filling curves.
The basic idea comes in two parts:
- First, Fibonacci coding lets you encode an arbitrarily large integer, without having to send the length of the integer before hand. (There’s a bunch of similar schemes you can use here, but the Fibs are fun and interesting.)
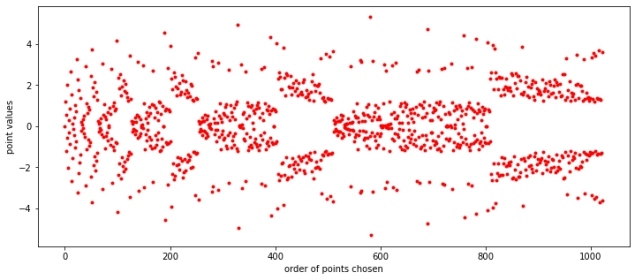
- Second, map the integers into the reals in a way that covers the normal distribution in a ‘progressive’ way, so that we can use small numbers if we don’t need high precision, and only use bigger numbers as we need more precision.
At the end we’ll run a few empirical tests and see how well the scheme works, and point to where there’s room for improvement.


